Strategy Tester Report
SMC Trader Kurt v21
AlpariUK-Demo (Build 225)
| Symbol | USDCAD (US Dollar vs Canadian Dollar) | ||||
| Period | 1 Hour (H1) 2009.12.01 00:00 - 2009.12.31 18:00 (2009.12.01 - 2010.01.01) | ||||
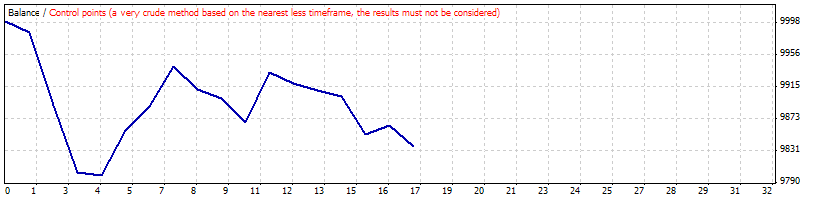
| Model | Control points (a very crude method, the results must not be considered) | ||||
| Parameters | TakeProfit=50; Lots=0.1; InitialStop=30; TrailingStop=20; | ||||
| Bars in test | 1515 | Ticks modelled | 13777 | Modelling quality | n/a |
| Mismatched charts errors | 2 | ||||
| Initial deposit | 10000.00 | ||||
| Total net profit | -163.32 | Gross profit | 218.49 | Gross loss | -381.81 |
| Profit factor | 0.57 | Expected payoff | -9.61 | ||
| Absolute drawdown | 260.70 | Maximal drawdown | 278.48 (2.78%) | Relative drawdown | 2.78% (278.48) |
| Total trades | 17 | Short positions (won %) | 8 (25.00%) | Long positions (won %) | 9 (33.33%) |
| Profit trades (% of total) | 5 (29.41%) | Loss trades (% of total) | 12 (70.59%) | ||
| Largest | profit trade | 65.43 | loss trade | -94.07 | |
| Average | profit trade | 43.70 | loss trade | -31.82 | |
| Maximum | consecutive wins (profit in money) | 3 (141.11) | consecutive losses (loss in money) | 4 (-200.36) | |
| Maximal | consecutive profit (count of wins) | 141.11 (3) | consecutive loss (count of losses) | -200.36 (4) | |
| Average | consecutive wins | 2 | consecutive losses | 3 | |
| # | Time | Type | Order | Size | Price | S / L | T / P | Profit | Balance |
| 1 | 2009.12.03 08:00 | sell | 1 | 0.10 | 1.04819 | 0.00000 | 0.00000 | ||
| 2 | 2009.12.03 12:00 | close | 1 | 0.10 | 1.04974 | 0.00000 | 0.00000 | -14.77 | 9985.23 |
| 3 | 2009.12.07 08:00 | sell | 2 | 0.10 | 1.05404 | 0.00000 | 0.00000 | ||
| 4 | 2009.12.07 10:00 | close | 2 | 0.10 | 1.06405 | 0.00000 | 0.00000 | -94.07 | 9891.16 |
| 5 | 2009.12.07 10:00 | buy | 3 | 0.10 | 1.06405 | 0.00000 | 0.00000 | ||
| 6 | 2009.12.07 16:00 | close | 3 | 0.10 | 1.05485 | 0.00000 | 0.00000 | -87.22 | 9803.94 |
| 7 | 2009.12.07 16:00 | sell | 4 | 0.10 | 1.05485 | 0.00000 | 0.00000 | ||
| 8 | 2009.12.08 09:00 | close | 4 | 0.10 | 1.05530 | 0.00000 | 0.00000 | -4.30 | 9799.64 |
| 9 | 2009.12.08 09:00 | buy | 5 | 0.10 | 1.05530 | 0.00000 | 0.00000 | ||
| 10 | 2009.12.09 05:00 | close | 5 | 0.10 | 1.06143 | 0.00000 | 0.00000 | 57.68 | 9857.33 |
| 11 | 2009.12.09 12:00 | sell | 6 | 0.10 | 1.05987 | 0.00000 | 0.00000 | ||
| 12 | 2009.12.10 06:00 | close | 6 | 0.10 | 1.05648 | 0.00000 | 0.00000 | 31.98 | 9889.30 |
| 13 | 2009.12.11 16:00 | buy | 7 | 0.10 | 1.05266 | 0.00000 | 0.00000 | ||
| 14 | 2009.12.14 08:00 | close | 7 | 0.10 | 1.05811 | 0.00000 | 0.00000 | 51.44 | 9940.75 |
| 15 | 2009.12.14 18:00 | sell | 8 | 0.10 | 1.05892 | 0.00000 | 0.00000 | ||
| 16 | 2009.12.15 10:00 | close | 8 | 0.10 | 1.06210 | 0.00000 | 0.00000 | -29.98 | 9910.77 |
| 17 | 2009.12.15 10:00 | buy | 9 | 0.10 | 1.06210 | 0.00000 | 0.00000 | ||
| 18 | 2009.12.15 23:00 | close | 9 | 0.10 | 1.06090 | 0.00000 | 0.00000 | -11.31 | 9899.46 |
| 19 | 2009.12.16 10:00 | sell | 10 | 0.10 | 1.05972 | 0.00000 | 0.00000 | ||
| 20 | 2009.12.16 21:00 | close | 10 | 0.10 | 1.06309 | 0.00000 | 0.00000 | -31.70 | 9867.76 |
| 21 | 2009.12.16 21:00 | buy | 11 | 0.10 | 1.06309 | 0.00000 | 0.00000 | ||
| 22 | 2009.12.18 01:00 | close | 11 | 0.10 | 1.07012 | 0.00000 | 0.00000 | 65.43 | 9933.19 |
| 23 | 2009.12.18 19:00 | sell | 12 | 0.10 | 1.06572 | 0.00000 | 0.00000 | ||
| 24 | 2009.12.21 01:00 | close | 12 | 0.10 | 1.06715 | 0.00000 | 0.00000 | -13.44 | 9919.75 |
| 25 | 2009.12.21 01:00 | buy | 13 | 0.10 | 1.06715 | 0.00000 | 0.00000 | ||
| 26 | 2009.12.21 06:00 | close | 13 | 0.10 | 1.06618 | 0.00000 | 0.00000 | -9.10 | 9910.65 |
| 27 | 2009.12.21 07:00 | buy | 14 | 0.10 | 1.06710 | 0.00000 | 0.00000 | ||
| 28 | 2009.12.21 08:00 | close | 14 | 0.10 | 1.06627 | 0.00000 | 0.00000 | -7.78 | 9902.87 |
| 29 | 2009.12.21 09:00 | buy | 15 | 0.10 | 1.06818 | 0.00000 | 0.00000 | ||
| 30 | 2009.12.21 12:00 | close | 15 | 0.10 | 1.06281 | 0.00000 | 0.00000 | -50.53 | 9852.34 |
| 31 | 2009.12.21 12:00 | sell | 16 | 0.10 | 1.06281 | 0.00000 | 0.00000 | ||
| 32 | 2009.12.21 21:00 | close | 16 | 0.10 | 1.06154 | 0.00000 | 0.00000 | 11.96 | 9864.30 |
| 33 | 2009.12.28 09:00 | buy | 17 | 0.10 | 1.04936 | 0.00000 | 0.00000 | ||
| 34 | 2009.12.28 14:00 | close | 17 | 0.10 | 1.04647 | 0.00000 | 0.00000 | -27.62 | 9836.68 |